National Housing Market December 20, 2019

2020 Economic & Housing Market Forecast

Posted in Economics 101 Videos and Market News by Matthew Gardner, Chief Economist, Windermere Real Estate

As we head toward the end of the year, it’s time to recap how the U.S. economy and housing markets performed this year and offer my predictions for 2020.


U.S. Economy

In general, the economy performed pretty much as I expected this year: job growth slowed but the unemployment rate still hovers around levels not seen since the late 1960s.

Following the significant drop in corporate tax rates in January 2018, economic growth experience a big jump. However, we haven’t been able to continue those gains and I doubt we’ll return to 2%+ growth next year. Due to this slowing, I expect GDP to come in at only +1.4% next year. Non-residential fixed investment has started to wane as companies try to anticipate where economic policy will move next year. Furthermore, many businesses remain concerned over ongoing trade issues with China.

In 2020, I expect payrolls to continue growing, but the rate of growth will slow as the country adds fewer than 1.7 million new jobs. Due to this hiring slow down, the unemployment rate will start to rise, but still end the year at a very respectable 4.1%.

Many economists, including me, spent much of 2019 worried about the specter of a looming recession in 2020. Thankfully, such fears have started to wane (at least for now).

Despite some concerning signs, the likelihood that we will enter a recession in 2020 has dropped to about 26%. If we manage to stave off a recession in 2020, the possibility of a slowdown in 2021 is around 74%. That said, I fully expect that any drop in growth will be mild and will not negatively affect the U.S. housing market.


Existing Homes

As I write this article, full-year data has yet to be released. However, I feel confident that 2019 will end with a slight rise in home sales. For 2020, I expect sales to rise around 2.9% to just over 5.5 million units.

Home prices next year will continue to rise as mortgage rates remain very competitive. Look for prices to increase 3.8% in 2020 as demand continues to exceed supply and more first-time buyers enter the market.

In the year ahead, I expect the share of first-time buyers to grow, making them a very significant component of the housing market.


New Homes

The new-home market has been pretty disappointing for most of the year due to significant obstacles preventing builders from building. Land prices, labor and material costs, and regulatory fees make it very hard for builders to produce affordable housing. As a result, many are still focused on the luxury market where there are profits to be made, despite high demand from entry-level buyers.

Builders are aware of this and are doing their best to deliver more affordable product. As such, I believe single-family housing starts will rise next year to 942,000 units—an increase of 6.8% over 2019 and the highest number since 2007.

As the market starts to deliver more units, sales will rise just over 5%, but the increase in sales will be due to lower priced housing. Accordingly, new home prices are set to rise just 2.5% next year.


Mortgage Rates

Next year will still be very positive from a home-financing perspective, with the average rate for a 30-year conventional, fixed-rate mortgage averaging under 4%. That said, if there are significant improvements in trade issues with China, this forecast may change, but not significantly.


Conclusion

In this coming year, affordability issues will persist in many markets around the country, such as San Francisco; Los Angeles; San Jose; Seattle; and Bend, Oregon. The market will also continue to favor home sellers, but we will start to move more toward balance, resulting in another positive year overall for U.S. housing.


About Matthew Gardner:

As Chief Economist for Windermere Real Estate, Matthew Gardner is responsible for analyzing and interpreting economic data and its impact on the real estate market on both a local and national level. Matthew has over 30 years of professional experience both in the U.S. and U.K.

In addition to his day-to-day responsibilities, Matthew sits on the Washington State Governors Council of Economic Advisors; chairs the Board of Trustees at the Washington Center for Real Estate Research at the University of Washington; and is an Advisory Board Member at the Runstad Center for Real Estate Studies at the University of Washington where he also lectures in real estate economics.

Local Market Update December 13, 2019

LOCAL MARKET UPDATE – DECEMBER 2019

EASTSIDE

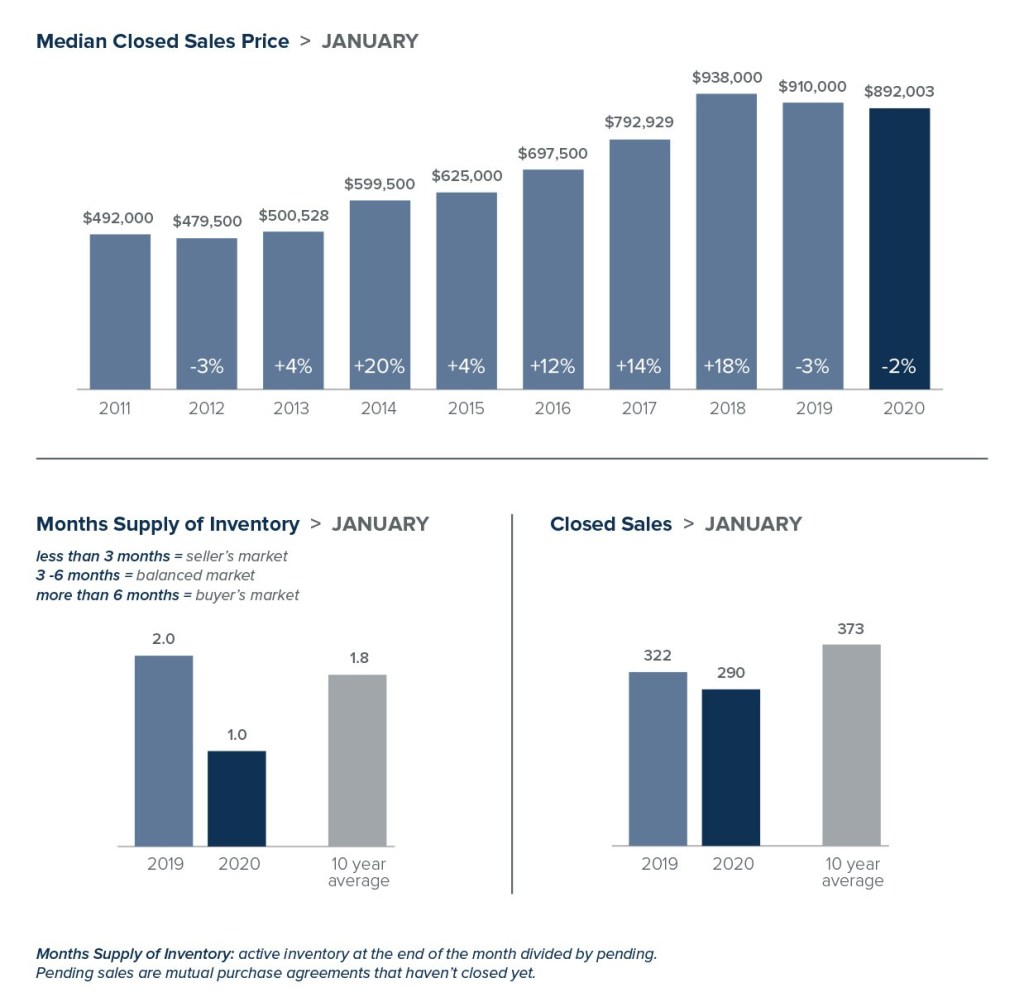
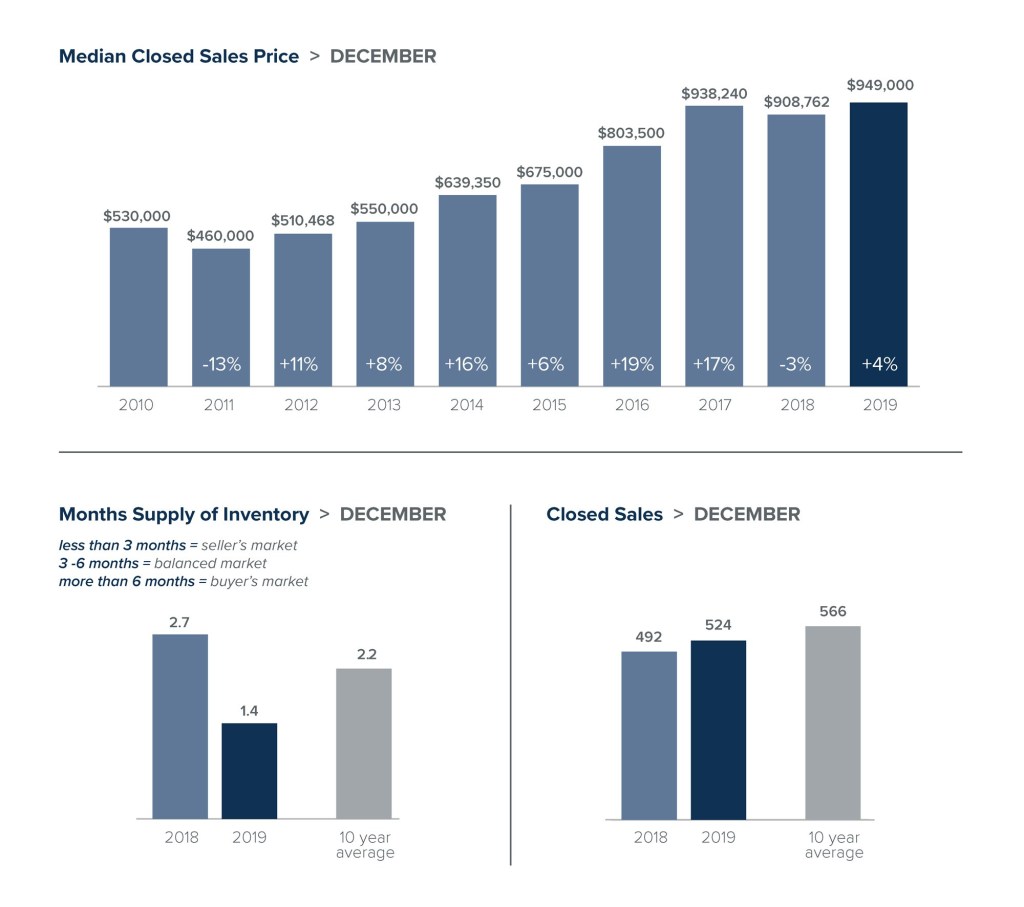
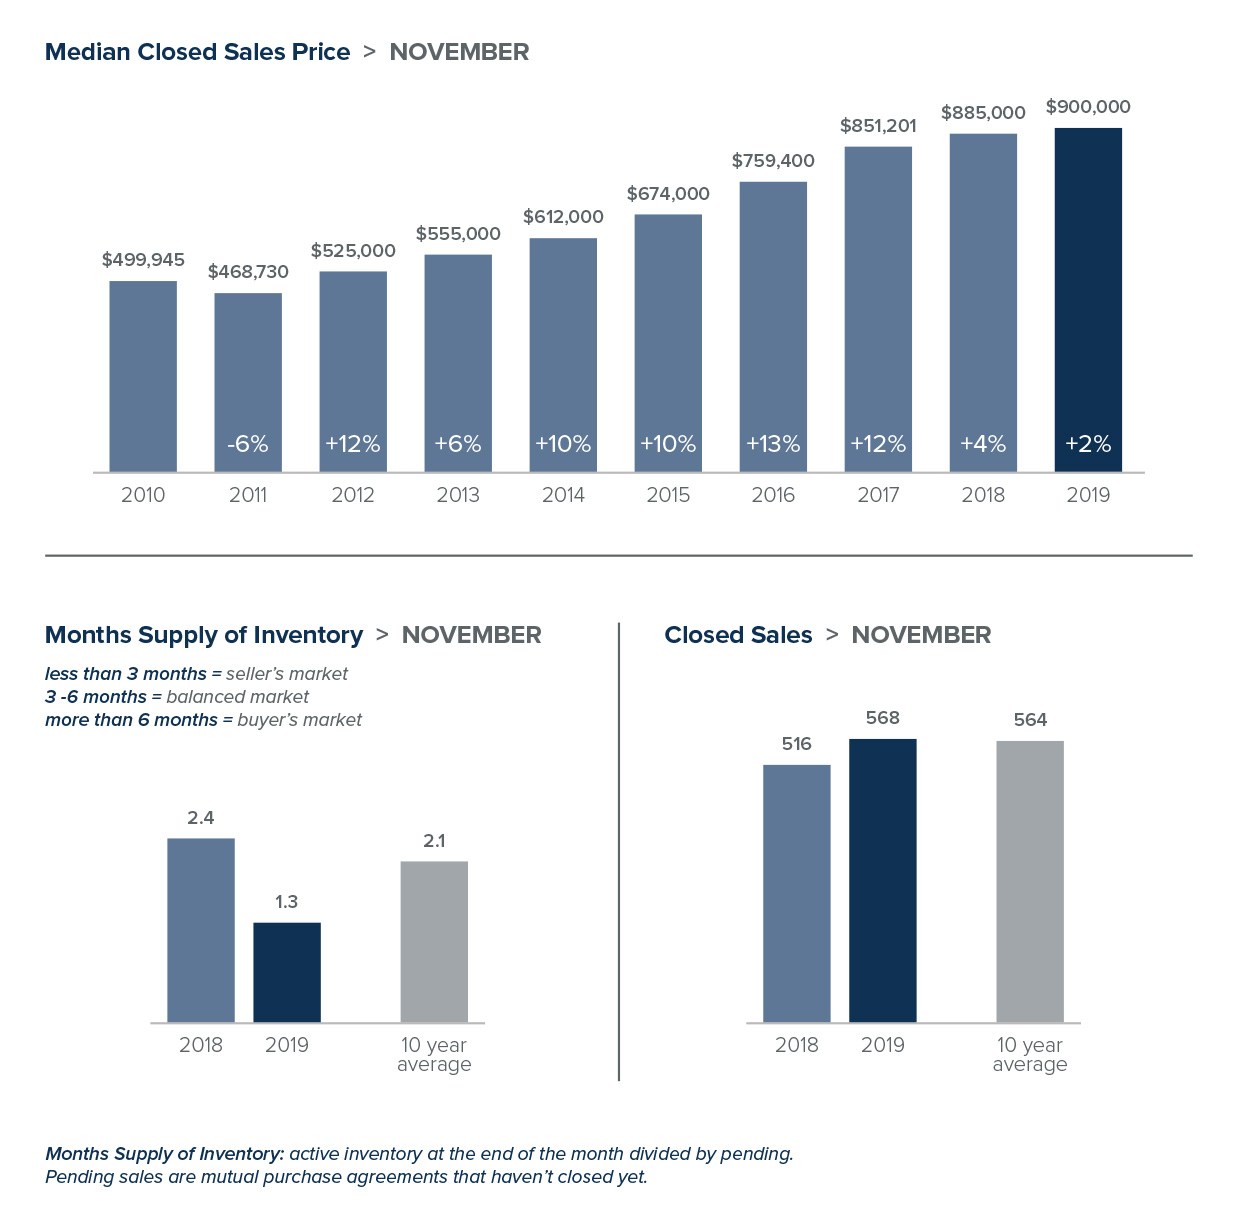
With just over a month of available inventory, demand on Eastside remains very strong. Sales are brisk, with 45% of single-family homes selling in 15 days or less and 20% of homes selling for over list price. The median single-family home price in November rose 2% from a year ago to $900,000 and was unchanged from October.

KING COUNTY

With more buyers vying for fewer homes, King County remains a solid seller’s market. While inventory traditionally shrinks in the winter, this November saw the number of new listings at historic lows. Demand was strong, with the number of closed sales up 12% over the same time last year. The median home price ticked up 3% over the prior year to $661,000 and was unchanged from October. The strong market sent prices higher in the more affordable price ranges, with some areas in South King County seeing double-digit increases.

SEATTLE

Activity in Seattle was very strong in November. The number of closed sales was up 29% over the same time last year. With just over one month of homes available for sale, the city is starved for inventory. Seattle homes prices have ebbed and flowed slightly from month to month for much of this year. The median price of a single-family home sold in November was off 3% from a year ago to $735,000.


SNOHOMISH COUNTY

With an increasing number of buyers driving to affordability, the Snohomish County housing market remains robust. Inventory is very tight and continues to fall. The county finished November with just over one month of supply. The median price of a single-family home rose 5% over a year ago to $495,000. That figure is unchanged from October.


To view report on original post, Click here.

National Housing Market October 28, 2019

THE GARDNER REPORT – THIRD QUARTER 2019

ECONOMIC OVERVIEW

Washington State employment has softened slightly to an annual growth rate of 2%, which is still a respectable number compared to other West Coast states and the country as a whole. In all, I expect that Washington will continue to add jobs at a reasonable rate though it is clear that businesses are starting to feel the effects of the trade war with China and this is impacting hiring practices. The state unemployment rate was 4.6%, marginally higher than the 4.4% level of a year ago. My most recent economic forecast suggests that statewide job growth in 2019 will rise by 2.2%, with a total of 88,400 new jobs created.

HOME SALES

  • There were 22,685 home sales during the third quarter of 2019, representing a slight increase of 0.8% from the same period in 2018 and essentially at the same level as in the second quarter.
  • Listing activity — which rose substantially from the middle of last year — appears to have settled down. This is likely to slow sales as there is less choice in the market.
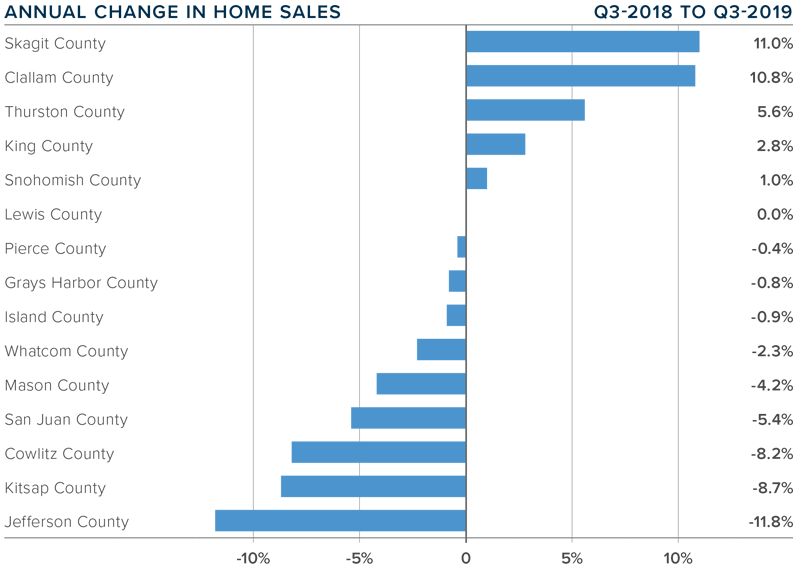
  • Compared to the third quarter of 2018, sales rose in five counties, remained static in one, and dropped in nine. The greatest growth was in Skagit and Clallam counties. Jefferson, Kitsap, and Cowlitz counties experienced significant declines.
  • The average number of homes for sale rose 11% between the second and third quarters. However, inventory is 14% lower than in the same quarter of 2018. In fact, no county contained in this report had more homes for sale in the third quarter than a year ago.

HOME PRICES

  • Home price growth in Western Washington notched a little higher in the third quarter, with average prices 4.2% higher than a year ago. The average sales price in Western Washington was $523,016. It is worth noting, though, that prices were down 3.3% compared to the second quarter of this year.
  • Home prices were higher in every county except Island, though the decline there was very small.
  • When compared to the same period a year ago, price growth was strongest in Grays Harbor County, where home prices were up 22%. San Juan, Jefferson, and Cowlitz counties also saw double-digit price increases.
  • Affordability issues are driving buyers further out which is resulting in above-average price growth in outlying markets. I expect home prices to continue appreciating as we move through 2020, but the pace of growth will continue to slow.

DAYS ON MARKET

  • The average number of days it took to sell a home dropped one day when compared to the third quarter of 2018.
  • Thurston County was the tightest market in Western Washington, with homes taking an average of only 20 days to sell. There were six counties where the length of time it took to sell a home dropped compared to the same period a year ago. Market time rose in six counties, while two counties were unchanged.
  • Across the entire region, it took an average of 38 days to sell a home in the third quarter. This was down 3 days compared to the second quarter of this year.
  • Market time remains below the long-term average across the region and this trend is likely to continue until more inventory comes to market, which I do not expect will happen until next spring.

CONCLUSIONS

This speedometer reflects the state of the region’s real estate market using housing inventory, price gains, home sales, interest rates, and larger economic factors. I am leaving the needle in the same position as the first and second quarters, as demand appears to still be strong.

The market continues to benefit from low mortgage rates. The average 30-year fixed rates is currently around 3.6% and is unlikely to rise significantly anytime soon. Even as borrowing costs remain very competitive, it’s clear buyers are not necessarily jumping at any home that comes on the market. Although it’s still a sellers’ market, buyers have become increasingly price-conscious which is reflected in slowing home price growth.


As Chief Economist for Windermere Real Estate, Matthew Gardner is responsible for analyzing and interpreting economic data and its impact on the real estate market on both a local and national level. Matthew has over 30 years of professional experience both in the U.S. and U.K.

In addition to his day-to-day responsibilities, Matthew sits on the Washington State Governors Council of Economic Advisors; chairs the Board of Trustees at the Washington Center for Real Estate Research at the University of Washington; and is an Advisory Board Member at the Runstad Center for Real Estate Studies at the University of Washington where he also lectures in real estate economics.

This post originally appeared on the Windermere.com Blog.

Local Market Update October 21, 2019

LOCAL MARKET UPDATE – OCTOBER 2019

While fall usually brings a decrease in sales activity, the opposite was true in September. The number of listings on the market dropped by double digits and home sales rose. It is still a seller’s market, however prices have stabilized. With interest rates near historic lows and employment levels at historic highs, the housing market is expected to stay strong throughout the fall and winter.

EASTSIDE:

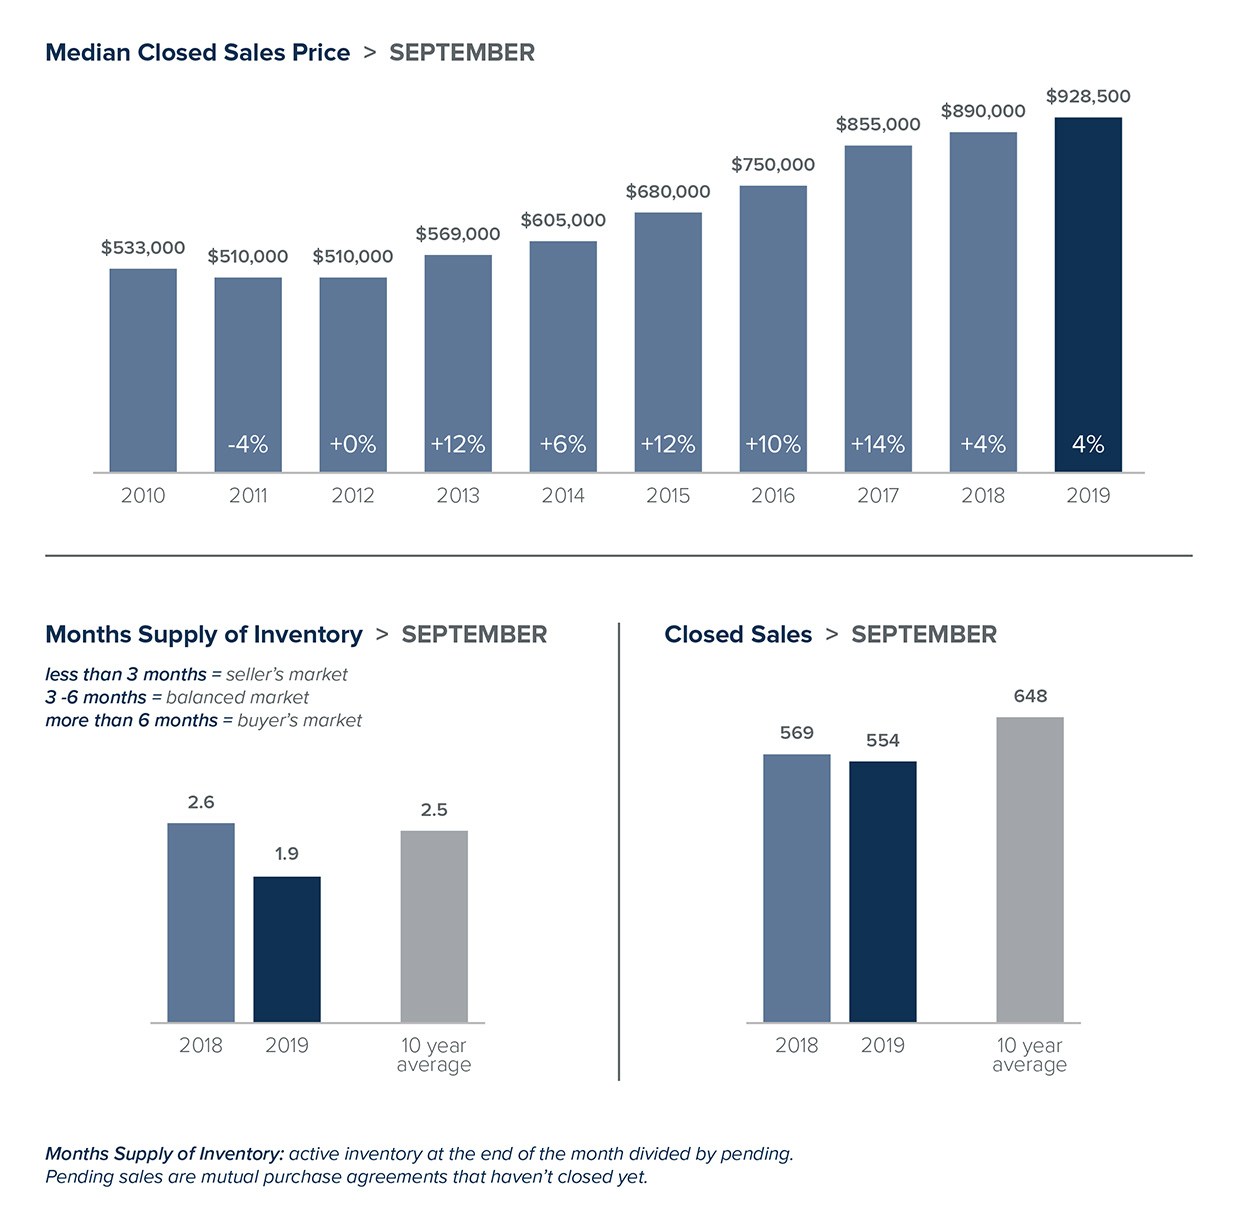
Long the most affluent area of King County, the Eastside continues to record the highest home prices in the region. The median price of a single-family home on the Eastside was $928,500 in September, an increase of 4% from a year ago and a decrease of less than 1% from August. The Eastside construction boom continues, indicating that developers remain confident in the strength of the local economy.

KING COUNTY:

The number of homes on the market in King County fell by almost 20% in September when compared to a year ago. However, last fall saw an increase in inventory that was unusual for the time of year. The median price of a single-family home was $660,000, down just 1% from the same time last year. Cities in King County, outside of Seattle, all saw price increases. Sales were up 7% indicating no shortage of buyers.

SEATTLE:

Prices remained relatively stable, with the median price of a single-family home in September dipping 3% over a year ago to $750,000. As tech companies continue to recruit top talent to the area, Seattle’s population keeps booming and demand for housing remains high. While home sales traditionally dip in the fall, the city saw sales increase by 12% in September as compared to last year. Rising rents may push more buyers into the market.


SNOHOMISH COUNTY:


Buyers continue to be drawn to Snohomish County thanks to a strong economy and housing costs that are considerably more affordable than King County. That influx of buyers is also driving up prices. The median price of a single-family home in September was $492,500, up from $484,995 the same time last year. At $167,500 less than the median price in King County, it’s a relative bargain.


View article on GettheWREPORT.com


Local Market Update October 9, 2019

Housing to Remain Strong Heading into the Fall

Though mortgage rates jumped in September, they remain down from where they were a year ago. The U.S. weekly average 30-year fixed-rate mortgage was 3.64% for the week ending September 26th, down 1.08 percentage points from a year earlier. Rates fell for most of this year and lower rates have translated into a stronger housing market. Both home sales and housing construction are firming. We expect a significant increase in mortgage refinance originations in the coming quarters.

Strong consumer confidence should bolster consumer spending, helping to maintain positive economic growth. However, consumer spending will not offset the deceleration in government spending, business investment, and net exports. After averaging 2.6% in the first half of this year, we expect GDP to average 1.9% in the second half of 2019. For the full year 2019, we forecast 2.2% growth, decelerating to 1.8% in 2020.

Consumer price inflation remains muted. The Consumer Price Index (CPI) increased 1.7% over the 12-months ending August 2019. Lower gas prices contained inflation in August. The core inflation measure that strips out volatile food and energy increased 2.4% in the 12-months ending August 2019. Stronger core inflation should translate to higher headline inflation in the coming months. We forecast the CPI will increase 2.2 and 2.3% at an annualized rate in the third and fourth quarter of 2019 respectively. However, we do not expect the acceleration in inflation to persist into next year. We forecast annual consumer price inflation of 2.0% in 2020, after averaging 2.1% in 2019.

The labor market remains strong. Jobless claims have stayed near historical lows while unemployment collection remains close to the lowest levels since the early 1970’s. Job openings have been higher than unemployment claims for an impressive 17 consecutive months. Job creation also continues to extend its record run of 107 consecutive months of growth. We expect the strong labor market to persist as the economy chugs along. We forecast an unemployment rate of 3.7% in the third and fourth quarters of 2019. Our full year 2019 forecast remains at 3.7 percent, before increasing to 3.8% in 2020.

Mortgage rates to remain low for foreseeable future
Concerns over the resolution of trade disputes have injected volatility into global bond markets. Investors have flocked to the safety and stability of U.S. Treasuries, pushing down interest rates. As trade talks ebb and flow, rates follow. Despite the volatility in rates, we expect long-term rates to remain flat on average. We forecast the 10-year yield to average 1.8% in 2020, down from an annual average of 2.1% in 2019.

Low treasury yields will keep mortgage rates subdued in the coming quarters. We project the 30-year fixed-rate mortgage to average 3.7% in the fourth quarter of 2019. We project the annual average to be 4.0% in 2019 before declining to 3.8% in 2020.

As anticipated, the Federal Reserve cut rates in September by a quarter percent. Our forecast is for another interest rate cut before the end of the year with one more to follow in 2020. The Federal Funds rate should stabilize at 1.6% in 2020.

Homes sales showing signs of recovery
Lower rates have boosted the housing market. Housing starts in August 2019 beat consensus estimates, increasing to 1.36 million units at an annual rate. The August level was the highest since 2007. Higher starts should provide some desperately needed new housing supply. We forecast annual housing starts to average 1.25 million in 2019, increasing to 1.28 million in 2020.

Home sales also responded to lower rates. Existing home sales in August 2019 also beat expectations. The National Association of Realtors reported 5.49 million existing home sales at an annual rate in August 2019. We expect the positive momentum in sales to carry over into the fourth quarter and early next year. We forecast that total home sales, including both new and existing homes, will be 5.98 million in 2019 and increase to 6.03 million in 2020.

Strong data over the last few months gives us reason to believe that house prices will continue to beat expectations in the coming months. We estimate that house prices will appreciate 3.4% in 2019, before tapering off slightly in 2020 at 2.6%.

After decelerating earlier in the year, house price appreciation has stabilized near our estimate of long-run house price growth. We forecast that annual house price appreciation will be 3.4% in 2019 before tapering to 2.7% in 2020.

Refinance originations expected to increase with low mortgage rates
Declining mortgage rates will boost mortgage origination volumes. The Mortgage Bankers Association Weekly Applications Survey reflects this, with the refinance index up 148% from September 2018. Surging refinance activity will lift the refinance share of mortgage originations to 44% for the full year 2019. Purchase mortgage originations have also seen a modest increase as home sales have increased. We expect total annual mortgage originations to be 2.1 trillion in 2019 and 1.8 trillion in 2020.

PREPARED BY THE ECONOMIC & HOUSING RESEARCH GROUP

http://www.freddiemac.com/research


http://www.freddiemac.com/research/forecast/20190930_housing_strong_heading_into_fall.page?


Uncategorized September 19, 2019

The fall housing market expected to be more of the same

September 10

High prices and a limited number of homes for sale have been the hallmarks of the Washington area’s housing market for years. Even as other markets nationwide have experienced increases in the number of homes for sale and slowing price increases, the capital region remains a seller’s market in many neighborhoods.

“The things that have been driving the market so far this year aren’t changing, so this fall we’ll see more of the same in the regional housing market,” says Chris Finnegan, vice president of marketing and communications for Bright MLS.

Those driving forces, Finnegan says, include low mortgage rates, strong employment and the Amazon effect, referring to the choice of National Landing in the Crystal City and Pentagon City areas of Arlington County, Va., for Amazon’s second headquarters.

The region is economically healthy because of the strength of the local labor market, says Terry Clower, director of the Center for Regional Analysis at George Mason University, but, he points out, there’s nothing more hyperlocal than the housing market.

“Even when you have buyers looking for a quality school district, they go beyond that to look for a house within the catchment area of a particular school,” Clower says. “There can be wide variations on home prices within adjacent neighborhoods because of the desirability of a particular school.”

At the end of 2018, the regional housing market was affected heavily by a partial government shutdown, stock market volatility, and mortgage rates that were above 4.5 percent and anticipated to rise, says Ben Sage, director of the Mid-Atlantic region for Metrostudy, a housing market research and consulting firm.

“Since then, those hindrances to the housing market have mostly been resolved,” Sage says. “The government reopened and the stock market stabilized, although it’s suffered again lately. Most importantly, mortgage rates dropped down below 4 percent again and are anticipated to stay low.”

Recession fears have roiled the stock market in recent weeks, but Finnegan doesn’t anticipate a recession harming the regional housing market anytime soon, particularly not this fall.

“The supply of homes is extremely low, and what’s on the market goes for premium prices,” Finnegan says.

Low mortgage rates have pushed home sales higher than anticipated this year, Clower says, because rates were expected to be higher. Lower mortgage rates reduce monthly interest payments and can help people qualify for a larger mortgage or feel more comfortable buying a slightly more expensive home.

Tale of three markets

Although the housing market across the area is experiencing increasing prices, tight inventory and a steady pace of sales, there are differences in every county and neighborhood. Low inventory continues to plague the District and Northern Virginia, Finnegan says, while in Maryland, inventory shortages are less pronounced.

“The District is an evergreen, blue chip market,” Finnegan says. “Condos in the city are selling fast because employment numbers are good and mortgage rates are low. First-time buyers are eager to get into the market.”

The median sales price in the District climbed to $592,500 in July, up 4 percent over July 2018, according to the Greater Capital Area Association of Realtors. However, the number of homes sold in the District dropped by 6.8 percent in July compared to July 2018, in part because of continued lack of inventory, which was 1.3 percent lower this July than it was last July. As an indication of the competitiveness of the District’s housing market, the average ratio of the sales price to the original list price was 99.4 percent in July.

Finnegan says that in Maryland, the strongest markets for first-time buyers are in Silver Spring in Montgomery County and in Prince George’s County because both areas have more affordable housing. In Prince George’s, perennially the most affordable in the region, the median sales price rose to $320,000 in July, a jump of 12.3 percent over July 2018, according to Bright.

“In Silver Spring and a lot of areas of Prince George’s County, you’re close to everything but you can get more house for your money than in the District or other suburbs,” Finnegan says.

Northern Virginia, Finnegan says, is “on fire because of Amazon.” (Amazon founder Jeff Bezos owns The Washington Post.)

Although the Amazon effect is most intense in the area surrounding National Landing, the site of Amazon’s HQ2 headquarters, the Northern Virginia region also experienced a tightening market. The number of active listings declined by 31 percent in July compared to July 2018, according to the Northern Virginia Association of Realtors. The average days on the market dropped by 35 percent, from 49 days in July 2018 to 32 days in July 2019. The median sales price rose by 1.45 percent in Northern Virginia, to $542,750.

A recent analysis by Redfin found that the two most competitive markets in the country for buyers are Alexandria and Arlington, adjacent to the new Amazon headquarters. In both locations, Redfin’s report says, the number of homes for sale fell by about 50 percent in July 2019 compared to July 2018. Homes that sold in July 2019 went off the market in a median of 11 days in Arlington and 24 days in Alexandria, far faster than the median of 27 days in the region and the 38-day national median.

“Homeowners in Arlington and the Zip codes around the Amazon headquarters are holding onto their properties to see how high values will go,” Finnegan says. “Those who do choose to sell now are asking higher prices and getting them because of the shortage of homes for sale.”

The Amazon effect is likely to have a domino effect as employees are hired, Sage says.

“Some families will prioritize schools and space and move to the best school districts, so we’re likely to see more competition in Fairfax County, Loudoun County and even Montgomery County,” Sage says.

Clower says some new Amazon hires are likely to move into the District, especially if they’re single and want an urban environment. He says the Amazon decision should have a ripple effect and encourage more tech companies to locate to the region.

“Another good impact is that this has called even more attention to the need for affordable housing in the area,” Clower says.

New construction

Increasing density with mid-rise and high-rise condos as well as townhouses and stacked condos that look like townhouses is likely to be part of the mix of new housing in the District and surrounding suburbs to address the need for more housing as well as affordability, Sage says.

“More construction is needed to address the limited inventory among existing homes and also because some listings that are available don’t match what people want,” Sage says. “New homes offer fresh floor plans, low maintenance and allow some level of personalization.”

The areas with the most new construction in the D.C. region are Prince George’s County, Anne Arundel County and Frederick County in Maryland.

“There’s just not as much land in Northern Virginia compared to those Maryland counties,” Sage says.

One trend Sage has identified is that home buyers are more sensitive to being closer to where they work.

“The old ‘drive until you qualify’ mentality is less common, which is why you see more people willing to compromise and either continue to rent or to buy a townhouse or condo rather than move farther out,” Sage says.

Clower says that although larger houses still sell, there’s a shift in consumer preferences.

“The big home on a large lot near public transit is not a hot market,” Clower says. “In every pocket of the region, we’re starting to see more opportunities for a variety of housing, including high-rise buildings, townhouses and traditional single-family homes. The goal is to build homes that are accessible and affordable to people in different phases of their lives.”

To read original article on The Washington Post,  click here.
Uncategorized August 22, 2019

Seattle home prices still dropping as Tacoma home values rise, study finds

The average July home sales price there was $375,000 – more than $20,000 above the average at the same time last year, for an increase of 5.6 percent.

Not only that, but nearly half of the homes in Tacoma – some 46.8 percent – were sold above their list price in July.

Homes sold quickly in Tacoma, too. The average home sold after only 11 days on the market – the second-fastest rate in the nation.

Those trends were a reversal of the picture from two years ago, when Seattle home prices were shooting up by 12 or 13 percent year-over-year and Tacoma home values were more stagnant.

As a result, Seattle has now become too pricey for many homebuyers, and Tacoma is now a more attractive real estate market.

Meanwhile, nationwide, median home prices rose by an average of 3 percent as the supply of homes for sale dropped by 3 percent.

“July home prices and sales were weaker than I had expected, especially given that falling mortgage rates have been luring homebuyers back to the market since early spring,” said Redfin chief economist Daryl Fairweather.

“Even though we’ve seen increased interest from homebuyers … uncertainties in the overall economy and talk of a looming recession have people feeling jittery about making a huge purchase and investment.”


View article on KomoNews 

Uncategorized July 26, 2019

LOCAL MARKET UPDATE – JULY 2019

The market in our region appears to be moderating. Inventory is up, prices are relatively stable and homes are taking a bit longer to sell. However, with less than two months of available inventory, supply is still far short of demand. Steady buyer activity, low interest rates and a thriving economy are making for a strong summer in the housing market.

Eastside

>>>Click image to view full report.

The median price of a single-family home on the Eastside was $950,000 in June, down 3% from the same time last year and up $21,000 from May. Many buyers are looking to take advantage of the Eastside jobs boom with Amazon announcing plans to build a 43-story tower in Bellevue and Google expecting to reach 1 million square feet of office space in Kirkland.

King County

>>>Click image to view full report.

There was good news for buyers in June as a growing supply of homes helped boost inventory close to 2012 listing levels. The median price of a single-family home in King County was $695,000. That figure is a 3% drop from a year ago and virtually unchanged from May. 33% of homes sold above list price; another sign prices are moderating when compared to 52% of homes sold over list price this time last year.

Seattle

>>>Click image to view full report.

Home inventory in Seattle inched slightly higher in June. However, with less than two months of supply, the city is still a solid seller’s market. Apple’s plan to turn Seattle into a key engineering hub can only add to demand. The median price of a single-family home in Seattle was $781,000, down 4% from a year ago and nearly unchanged from May.

Snohomish County

>>>Click image to view full report.

After hovering around $500,000 since March, home prices in Snohomish County crept up in June. The median price of a single-family home was $515,500, as compared to $511,500 last June. Snohomish County continues to attract buyers priced out of the King County market, putting an additional strain on supply which stands a just 1.5 months of inventory.

To view on WindermereEastside.com, click here.

Uncategorized July 3, 2019

SEATTLE MAKES AFFORDABLE HOUSING MANDATORY IN UPZONED NEIGHBORHOODS

Architects and developers building across much of Seattle will soon have to meet the city’s new Mandatory Housing Affordability (MHA) requirements, a set of rules passed with a spate of recent comprehensive zoning changes designed to ensure that “new commercial and multifamily residential development contributes [new] affordable housing.”

The MHA regulations were approved this spring and are expected to add over 6,000 new low-income housing units to the city’s housing stock over the next decade. The changes are part of the city’s Housing Affordability and Living Agenda, a three-pronged effort undertaken by city agencies several years ago to increase housing supply in order to stem escalating rents and property values across the thriving region. The fiercely contested changes in land use will allow for a greater level of residential density in many of the city’s neighborhoods and will ask builders to either include affordable housing on-site or pay into a general fund that can be used by city agencies to create new affordable housing in other areas.

Seattle’s latest zoning changes promote affordability through mandatory minimums. (Courtesy of the City of Seattle)

The new regulations span five categories of development density, from low-rise detached and row house neighborhoods to taller mixed-use districts where buildings will be allowed to rise to a height of 95 feet or more. The efforts will upzone roughly 6 percent of the city’s single-family zones. Single-family zones ultimately make up over 80 percent of the city’s residential areas.

MHA regulations, according to planning documents provided by the City of Seattle, will be pegged to the degree of upzoning that takes place: Under the plan, areas that have been upzoned most significantly will be required to add a relatively higher proportion of new affordable housing. The required fees administered in lieu of on-site affordable housing construction will start at $5.58 per square foot for projects located in low-rise areas outside downtown Seattle and will go as high as $35.75 per square foot for larger mixed-use developments, according to city agencies.

The requirements will necessarily affect the work of architects designing buildings in these areas, but it is so far unclear exactly how.  The MHA requirements are set to go into effect immediately, as the city’s rezoning initiatives are approved on a neighborhood-by-neighborhood basis.

This was originally posted on The Architect’s Newspaper.

Uncategorized June 21, 2019

LOCAL MARKET UPDATE – JUNE 2019

The pace of the housing market gained momentum in May, bringing an uptick in open house traffic and offers. A drop in interest rates and increased inventory were great incentives for buyers. Despite the increase in supply there is less than two months of inventory available – half the national average and far short of what is considered balanced. Industry experts are predicting a strong market as we segue into summer.

Eastside

>>>Click image to view full report.

The median price of a single-family home on the Eastside was $928,800 in May, down 3% from the same time last year and virtually unchanged from April. With a booming economy that continues to grow, news of Amazon’s expansion in Bellevue, the latest Microsoft acquisition and plans for a $1.2 billion office park in Redmond, demand for housing on the Eastside is unlikely to decrease any time soon.

King County

>>>Click image to view full report.

Home sale activity in King County was brisk in May. According to a Windermere analysis, 7 out of 10 properties sold last month had 15 or fewer days on the market. More than half of the homes sold at or above list price. The median price of a single-family home was $700,000. While down 4% from the same time last year, that price was up about $22,000 from the previous month. Home to the fastest growing economy in the country,  King County is expected to draw even more buyers to the area this year.

Seattle

>>>Click image to view full report.

Seattle employment continues to grow faster than in most of the country.  This has made the city a top location for workers, particularly millennials.  Demand has put a strain on available homes, reducing the supply to just seven weeks of inventory available. May home prices in Seattle were lower than they were a year ago, but showed a healthy increase from the previous month. The median price of a single-family home was $784,925 in May, down 5% from a year ago and up $30,000 from April.

Snohomish County

>>>Click image to view full report.

In May, the median price of a single-family home in Snohomish County was $499,950. That number remains unchanged from a year ago, and also unchanged from March and April. Despite a 44% increase in inventory, the supply of homes for sale in this area is even tighter than in King County.  Brokers report that buyers are being drawn from King County and willing to trade a longer work commute for more affordable housing.


To view article on windermereeastside.com, click here.