Uncategorized December 21, 2018

2019 Economic and Housing Forecast

What a year it has been for both the U.S. economy and the national housing market. After several years of above-average economic and home price growth, 2018 marked the start of a slowdown in the residential real estate market. As the year comes to a close, it’s time for me to dust off my crystal ball to see what we can expect in 2019.

The U.S. Economy

Despite the turbulence that the ongoing trade wars with China are causing, I still expect the U.S. economy to have one more year of relatively solid growth before we likely enter a recession in 2020. Yes, it’s the dreaded “R” word, but before you panic, there are some things to bear in mind.

Firstly, any cyclical downturn will not be driven by housing.  Although it is almost impossible to predict exactly what will be the “straw that breaks the camel’s back”, I believe it will likely be caused by one of the following three things: an ongoing trade war, the Federal Reserve raising interest rates too quickly, or excessive corporate debt levels. That said, we still have another year of solid growth ahead of us, so I think it’s more important to focus on 2019 for now.

The U.S. Housing Market

Existing Home Sales

This paper is being written well before the year-end numbers come out, but I expect 2018 home sales will be about 3.5% lower than the prior year. Sales started to slow last spring as we breached affordability limits and more homes came on the market.  In 2019, I anticipate that home sales will rebound modestly and rise by 1.9% to a little over 5.4 million units.

Existing Home Prices

We will likely end 2018 with a median home price of about $260,000 – up 5.4% from 2017.  In 2019 I expect prices to continue rising, but at a slower rate as we move toward a more balanced housing market. I’m forecasting the median home price to increase by 4.4% as rising mortgage rates continue to act as a headwind to home price growth.

New Home Sales

In a somewhat similar manner to existing home sales, new home sales started to slow in the spring of 2018, but the overall trend has been positive since 2011. I expect that to continue in 2019 with sales increasing by 6.9% to 695,000 units – the highest level seen since 2007.

That being said, the level of new construction remains well below the long-term average. Builders continue to struggle with land, labor, and material costs, and this is an issue that is not likely to be solved in 2019. Furthermore, these constraints are forcing developers to primarily build higher-priced homes, which does little to meet the substantial demand by first-time buyers.

Mortgage Rates

In last year’s forecast I suggested that 5% interest rates would be a 2019 story, not a 2018 story. This prediction has proven accurate with the average 30-year conforming rates measured at 4.87% in November, and highly unlikely to breach the 5% barrier before the end of the year.

In 2019, I expect interest rates to continue trending higher, but we may see periods of modest contraction or leveling.  We will likely end the year with the 30-year fixed rate at around 5.7%, which means that 6% interest rates are more apt to be a 2020 story.

I also believe that non-conforming (or jumbo) rates will remain remarkably competitive. Banks appear to be comfortable with the risk and ultimately, the return, that this product offers, so expect jumbo loan yields to track conforming loans quite closely.

Conclusions

There are still voices out there that seem to suggest the housing market is headed for calamity and that another housing bubble is forming, or in some cases, is already deflating.  In all the data that I review, I just don’t see this happening. Credit quality for new mortgage holders remains very high and the median down payment (as a percentage of home price) is at its highest level since 2004.

That is not to say that there aren’t several markets around the country that are overpriced, but just because a market is overvalued, does not mean that a bubble is in place. It simply means that forward price growth in these markets will be lower to allow income levels to rise sufficiently.

Finally, if there is a big story for 2019, I believe it will be the ongoing resurgence of first-time buyers. While these buyers face challenges regarding student debt and the ability to save for a down payment, they are definitely on the comeback and likely to purchase more homes next year than any other buyer demographic.

Originally published on Inman News and the Windermere.com Blog.

Matthew Gardner is the Chief Economist for Windermere Real Estate, specializing in residential market analysis, commercial/industrial market analysis, financial analysis, and land use and regional economics. He is the former Principal of Gardner Economics, and has more than 30 years of professional experience both in the U.S. and U.K.


TO VIEW ON WINDERMEREEASTSIDE.COM CLICK, HERE.

Uncategorized December 13, 2018

Local Market Update – December 2018

The real estate market continued to improve for buyers in November.  Interest rates dropped slightly, price increases slowed and inventory soared. It’s important to note that inventory increases, while significant, are being compared to the record low supply of last year. We’re still far short of the inventory needed for a truly balanced market, however buyers have greater choice and less competition than they’ve had in years. Sellers who price their home according to current market conditions continue to see strong interest. Heading into the holiday season, there’s something for everyone to celebrate.

Eastside

>>>Click image to view full report.

The Eastside economy continues to be very strong. Heavy investment in commercial construction from companies such as Vulcan boost expectations that the area will continue to thrive.  The median price of a single-family home in November hit $885,000 on the Eastside. Although an increase of 4 percent from a year ago, home prices have remained steady since this fall. With continued demand and only 2.4 months of inventory, the market has a long way to go to becoming balanced.

King County

>>>Click image to view full report.

Price increases continued to slow in King County. The median single-family home price was $643,913 in November, an increase of 2 percent over a year ago. South King County, where the most affordable homes in the county are located, saw significantly greater increases compared to a year ago. North King County also posted greater increases than the county overall. Inventory has skyrocketed as the number of homes for sale in King County more than doubled year-over-year. While that’s good news for buyers, there is only 2.1 months of available inventory in the county, slightly down from October and not nearly enough to meet demand.

Seattle

>>>Click image to view full report.

The median price of a single-family home in Seattle was $760,000 in November. This is up 3 percent from a year ago and slightly up from October. Inventory jumped 177 percent year-over-year however, at just two months of supply, the Seattle area has the tightest inventory in King County. With the city’s strong economy and lifestyle appeal, that’s not expected to change any time soon. Forbes recently named Seattle as the best place for business and careers in the nation. U.S. News & World Report ranked the University of Washington among the top ten universities in the world with Money Magazine rating Seattle the #5 Best Big City to Live In.

Snohomish County

>>>Click image to view full report.

Inventory in Snohomish County continued to climb, surging 88 percent in November as compared to a year ago. That said, the area has fewer homes for sale than King County with just 1.8 months of inventory. This is still far short of the four to six months of supply that is considered a balanced market. The median price of a single-family home sold in November was up 6 percent from last year to $470,000, virtually unchanged from October.


Read full article on windermereeastside.com

Uncategorized December 6, 2018

Mortgage rates drop to 2-month low—an unexpected holiday gift to housing

Americans may be losing money in their stock portfolios this week, but they are gaining purchasing power in the housing market. Mortgage rates are falling sharply, as investors head to the relative safe haven of the bond market.

Mortgage rates follow loosely the yield on the 10-year U.S. Treasury.

The average rate on the popular 30-year fixed has fallen 21 basis points in the past week, from 4.94 percent to 4.73 percent on Thursday, according to Mortgage News Daily. This rate is for borrowers with good credit and strong down payments. The drop comes after the 30-year fixed hit a recent eight-year high of 5.05 percent at the start of November.

“Lenders are going to vary a bit, both in general, and specifically with respect to recent volatility,” said Matthew Graham, chief operating officer at Mortgage News Daily. “The important measurement is the change from the recent highs. In that regard, most lenders are roughly 3/8ths of a percentage point lower in rate than they were a month ago, which comes out to a savings of roughly $70 per month on a $300,000 loan.”

Rising rates have caused a significant slowdown in sales of new and existing homes. This week, the CEO of luxury homebuilder Toll Brothers blamed higher rates for a double-digit drop in new orders for its homes in the most recent quarter.

Homebuilder sentiment dropped to a two-year low in November on higher rates, and housing sentiment among consumers is also falling. A majority of consumers surveyed in October by Fannie Mae said they did not expect mortgage rates to decrease in the next year.

While December is the slowest month for the housing market, home price gains have been easing and competition is lower. The most recent drop in rates has suddenly put some wavering buyers jumping back in.

“We have not seen an increase in refinances, but we have seen a jump in buyers applying for new mortgages,” said Todd Probasco, vice president mortgage sales manager at Lakeside Bank in Chicago. “These folks may have been people who were not sure if they were ready to buy, but now they are.”

Uncategorized November 30, 2018

Bringing Your Plants Inside for Winter

Winters in many parts of the Western U.S. can easily see temperatures that dip down below freezing. For many gardening homeowners, this can be troublesome when precious plants are concerned. Covering your plants with sheets may not be enough to save a plant from succumbing to freezing temperatures. Check out these ways to bring your plants inside for winter:

Take Inventory of Plants

Unless you have planted exotic plants that are definitely not going to survive cold temperatures, there are probably more than a few plants within your yard that should be okay. Healthy native plants are used to the climate of your area and should be able to withstand the winter temperatures without any issue. Those plants that are better suited for a higher growing zone will need to be cared for in order to best survive the season. Consider every plant within your yard and access their health, maturity, and location in order to choose which plants to bring indoors.

Indoor Placement

Exotic plants love the sun and should be placed near southern facing windows that aren’t drafty or cold. Create a spot within your home that is far from drafts or cold breezes from open doors. Spread plastic sheeting to protect flooring and create a little greenhouse group of plants that will still receive plenty of sunlight. Refrain from placing plants too close together in order to allow for equal access to sunlight and air flow.

Container Issues

Many potted plants can easily be moved indoors without having to transplant them. Easily place potted plants in a group to ride out the winter season. In-ground plants within your landscape will need to be transplanted to a container in order to bring them indoors. Make sure that you consider the size of the plant and use a container that is big enough around for the root ball of the plant. Using a container that is much too large for a plant is better than one that is too small and could damage the plant’s root system.

Keep the Fan On

Many indoor plants enjoy being near a window but will also need adequate air circulation to prevent soggy soil conditions. It is a good idea to keep the ceiling fan on in the room, at a low speed, in order to keep the air moving within the room. Don’t place plants too close to heating vents in order to keep them from becoming too hot and overheated. Plants that produce browning leaves will need to be moved to a room with a humidifier in order to keep them in good condition as well.

Keep Pets Away

Many indoor plants can become curious items for an indoor pet. Make sure to keep pets away from plants in order to keep both safe. Some tropical plants are toxic for animals and some pets can prove damaging to plants. Create a barrier between plants and animals so that both are kept safe during the winter season.

Water & Dust

Keeping your plants watered indoors may look different than what it receives in an outdoor environment. Make sure to consider the plant before watering in order to keep it in soil that it prefers. Many winter climates will not see a lot of added water so choosing to water your indoor plants at a minimum will help mimic those conditions that it would receive outside.

Also, check the plants for accumulating dust that can easily be found after a few weeks indoors. Dust off plants on a regular basis in order to keep them healthy and able to absorb important nutrients. Use a wet cloth to gently wipe down leaves in order to keep dust free from indoor plants.

There are many things to consider when choosing to bring plants indoors for winter. Make sure to choose plants carefully and monitor their progress as the winter season wears on. Consider all of these tips for bringing your plants inside for winter in order to keep them from freezing outdoors.

Kelly Holland is a gardening and landscape design writer who loves experimenting in her kitchen. Her quirky nature loves a bright color palette so naturally, her coveted garden is covered in a rainbow of fruits, vegetable, and flowers. 

This post originally appeared on the Windermere.com blog.
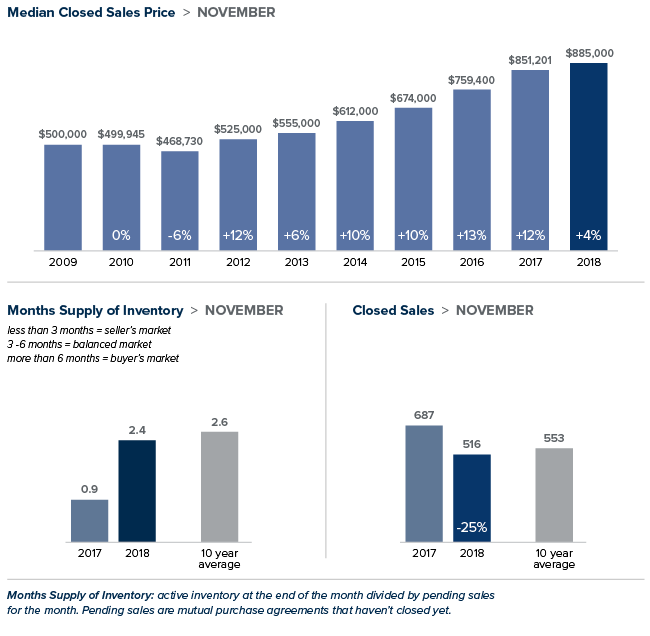
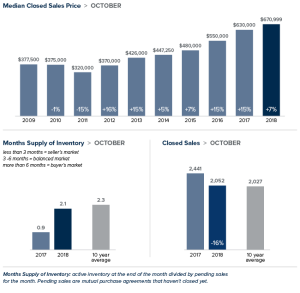
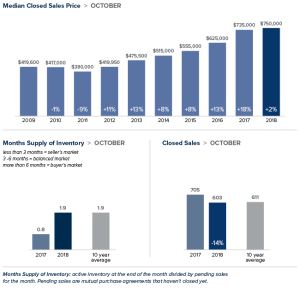
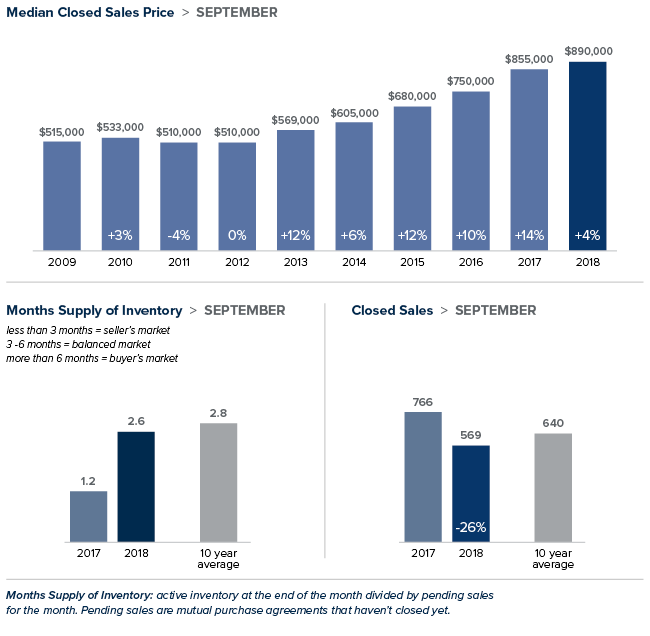
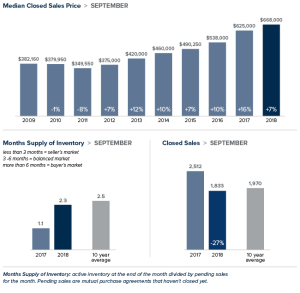
Uncategorized November 14, 2018

Local Market Update – November 2018

Increased inventory, slower sales and more price reductions all point to a balancing market—welcome news for price-shocked buyers. Sales prices are up from last October and down from the all-time high reached this spring. Despite the slowdown, it’s important to point out that we’re only moving back toward what a normal market looks like. King and Snohomish counties each have over two months of available inventory. While that is double the inventory of a year ago, it’s far short of the four to six months supply that is considered a balanced market. Sellers looking to list their home now can be sure there remains plenty of interest among home buyers.

Eastside

>>>Click image to view full report.

The median home on the Eastside sold for $890,000 in October, up 5 percent from a year ago and unchanged from the previous month.  While year-over-year price increases were in the single digits for the Eastside overall, several areas, including Kirkland, Woodinville and Mercer Island, experienced double-digit price gains.  Buyers are still having to pay a premium for desirable Eastside properties. However, with more choices and less buyer urgency, sellers need to price their home correctly to maximize their chances of getting the best possible return.

King County

>>>Click image to view full report.

Inventory in King County for all homes, both single-family and condominium, soared 102 percent over last October.  The increase was due to an influx of new listings and the fact that homes are now taking longer to sell than at the peak of the market this spring. While buyers now have more breathing room to make their decisions, the 2.4 months of inventory in King County is still far from a balanced market. The median price of a single-family home in October was $670,999, an increase of 7 percent from the same time last year, and virtually unchanged from August and September.  South King County showed larger increases, with prices rising more than 10 percent from a year ago in Auburn, Kent and Renton.

Seattle

>>>Click image to view full report.

In October, the median price of a single-family home in Seattle was $750,000, up 2 percent from last October and down slightly from last month. While inventory doubled over a year ago, Seattle falls behind most areas of King County in supply with just under two months of inventory available.  Demand is predicted to stay high, with Seattle’s population projected to grow at twice the national rate next year. That said, buyers are in the position to be able to negotiate.  A recent analysis named Seattle as one of the top markets in the country where it makes the most sense to buy this winter.

Snohomish County

>>>Click image to view full report.

Inventory in Snohomish County soared 65 percent in October as compared to a year ago. The area now has 2.4 months of inventory, about the same relative supply as King County. As with most of the Puget Sound area, the increase in inventory was due to a higher number of sellers listing their homes and fewer sales. Year-over-year, the median price of a single-family home sold in October in Snohomish County grew 8 percent to $473,000.  The median price in September was $485,000.

To read article on windermereeastside.com click, here.

Uncategorized November 7, 2018

Planning for the Life Expectancy of Your Home

Posted in Living by John Trupin 

Nothing in life lasts forever – and the same can be said for your home. From the roof to the furnace, every component of your home has a lifespan, so it’s a good idea to know approximately how many years of service you can expect from them. This information can help when buying or selling your home, budgeting for improvements, and deciding between repairing or replacing when problems arise.

According to a National Association of Home Builders (NAHB) study, the average life expectancy of some home components has decreased over the past few decades.  (This might explain why you’re on your third washing machine while Grandma still has the same indestructible model you remember from childhood.) But the good news is the lifespan of many other items has actually increased in recent years.

Here’s a look at the average life spans of some common home components (courtesy of NAHB).

Appliances. Of all home components, appliances have the widest variation in life spans. These are averages for all brands and models and may represent the point which replacing is more cost-effective than repairing. Among major appliances, gas ranges have the longest life expectancy, at about 15 years. Electric ranges, standard-size refrigerators, and clothes dryers last about 13 years, while garbage disposals grind away for about 10 years. Dishwashers, microwave ovens, and mini-refrigerators can all be expected to last about nine years. For furnaces, expect a lifespan of about 15 years for electric, 18 for gas, and 20 for oil-burning models. Central air-conditioning systems generally beat the heat for 10 to 15 years.

Kitchen & Bath. Countertops of wood, tile, and natural stone will last a lifetime, while cultured marble will last about 20 years. The lifespan of laminate countertops depends greatly on the use and can be 20 years or longer. Kitchen faucets generally last about 15 years.  An enamel-coated steel sink will last five to 10 years; stainless will last at least 30 years; and slate, granite, soapstone, and copper should endure 100 years or longer. Toilets, on average, can serve at least 50 years (parts such as the flush assembly and seat will likely need replacing), and bathroom faucets tend to last about 20 years.

Flooring. Natural flooring materials provide longevity as well as beauty: Wood, marble, slate, and granite should all last 100 years or longer, and tile, 74 to 100 years. Laminate products will survive 15 to 25 years, linoleum about 25 years, and vinyl should endure for about 50 years. Carpet will last eight to 10 years on average, depending on use and maintenance.

Siding, Roofing, Windows. Brick siding normally lasts 100 years or longer, aluminum siding about 80 years, and stucco about 25 years. The lifespan of wood siding varies dramatically – anywhere from 10 to 100 years – depending on the climate and level of maintenance. For roofs, slate or tile will last about 50 years, wood shingles can endure 25 to 30 years, the metal will last about 25 years, and asphalts got you covered for about 20 years. Unclad wood windows will last 30 years or longer, aluminum will last 15 to 20 years, and vinyl windows should keep their seals for 15 to 20 years.

Of course, none of these averages matter if you have a roof that was improperly installed or a dishwasher that was a lemon right off the assembly line. In these cases, early replacement may be the best choice. Conversely, many household components will last longer than you need them to, as we often replace fully functional items for cosmetic reasons, out of a desire for more modern features, or as a part of a quest to be more energy efficient.

Are extended warranties warranted?

Extended warranties, also known as service contracts or service agreements, are sold for all types of household items, from appliances to electronics. They cover service calls and repairs for a specified time beyond the manufacturer’s standard warranty. Essentially, warranty providers (manufacturers, retailers, and outside companies) are betting that a product will be problem-free in the first years of operation, while the consumer who purchases a warranty is betting against reliability.

Warranty providers make a lot of money on extended warranties, and Consumers Union, which publishes Consumer Reports, advises against purchasing them.  You will have to consider whether the cost is worth it to you; for some, it brings a much-needed peace of mind when making such a large purchase. Also, consider if it the cost outweighs the value of the item; in some cases, it may be less expensive to just replace a broken appliance than pay for insurance or a warranty.

View article on Windermere.com/blogs

Uncategorized November 2, 2018

The Gardner Report – Third Quarter 2018

The following analysis of the Western Washington real estate market is provided by Windermere Real Estate Chief Economist Matthew Gardner. We hope that this information may assist you with making better-informed real estate decisions. For further information about the housing market in your area, please don’t hesitate to contact your Windermere Agent. 

Economic Overview

Washington State continues to be one of the fastest growing states in the nation and there is little to suggest that there will be any marked slowdown in the foreseeable future. Over the past year, the state has added 105,900 new jobs, representing an annual growth rate of 3.2%. This remains well above the national rate of 1.65%. Private sector employment gains continue to be robust, increasing at an annual rate of 3.7%. The strongest growth sectors were Construction (+7.4%), Information (+6.2%), and Professional & Business Services (+6.1%). The state’s unemployment rate was 4.5%, down from 4.8% a year ago.

All year I’ve been predicting that Washington State’s annual job growth would outperform the nation as a whole, and we now know with certainty that this is going to be the case. Furthermore, I am now able to predict that statewide job growth in 2019 will be equally strong, with an expected increase of 2.6%.

Home Sales Activity

  • There were 22,310 home sales during the third quarter of 2018. This is a significant drop of 12.7% compared to the third quarter of 2017.

  • The number of homes for sale last quarter was up 14.5% compared to the third quarter of 2017, continuing a trend that started earlier in the year. However, the increase in listings was only in Seattle’s tri-county area (King, Pierce, and Snohomish Counties) while listing activity was down across the balance of the region.

  • Only two counties had a year-over-year increase in home sales, while the rest of Western Washington saw sales decrease.

  • The region has reached an inflection point. With the increase in the number of homes for sale, buyers now have more choices and time to make​ a decision about what home to buy.

Home Prices

  • Home prices, although higher than a year ago, continue to slow due to the significant increase in the number of homes for sale. This, in my opinion, is a very good thing.​​

  • When compared to the same period a year ago, price growth was strongest in Lewis County, where home prices were up 15.3%. Six other counties experienced double-digit price increases.

  • Slowing price growth was inevitable; we simply could not sustain the increases we’ve experienced in recent years. Lower rates of appreciation will continue until wage growth catches up.

Days on Market

  • The average number of days it took to sell a home dropped by four days compared to the same quarter of 2017.

  • Across the entire region, it took an average of 39 days to sell a home in the third quarter of this year. This is down from 43 days in the third quarter of 2017 and down 2 days when compared to the second quarter of 2018.​
  • King County continues to be the tightest market in Western Washington, with homes taking an average of only 19 days to sell. Every county in the region other than Skagit and King — which both saw the time on the market rise by 2 days — saw the length of time it took to sell a home drop when compared to the same period a year ago.

  • More choice in the market would normally suggest that the length of time it takes to sell a home should rise, but the data has yet to show that. That said, compared to last quarter, we are seeing some marked increases in days on market in several counties, which will be reflected in future reports.

Conclusions

This speedometer reflects the state of the region’s real estate market using housing inventory, price gains, home sales, interest rates, and larger economic factors. I started to move the needle toward buyers last quarter and have moved it even further this quarter. Price growth continues to slow, but more significant is the rise in listings, which I expect to continue as we move toward the quieter winter period.

I believe that psychology will start to play a part in the housing market going forward. It has been more than 15 years since we’ve experienced a “balanced” market, so many home buyers and sellers have a hard time remembering what one looks like. Concerns over price drops are overrated and the length of time it’s taking to sell a home is simply trending back to where it used to be in the early 2000s.


Matthew Gardner is the Chief Economist for Windermere Real Estate, specializing in residential market analysis, commercial/industrial market analysis, financial analysis, and land use and regional economics. He is the former Principal of Gardner Economics, and has more than 30 years of professional experience both in the U.S. and U.K.


This post originally appeared on the Windermere.com Blog.

Uncategorized October 12, 2018

Local Market Update – October 2018

It appears that balance is slowly returning to the local housing market. Home price growth slowed in September. Inventory continued to climb, but is still far short of the four to six months that indicate a normal market. Homes are staying on the market longer, giving buyers the breathing room to make the right choice for their situation.  With our region’s healthy job growth, and demand still exceeding supply, it’s likely to take some time to move to a fully balanced market.

Eastside

>>>Click image to view full report.

Home price increases moderated into the single-digits in September. The median price of a single-family home on the Eastside was up 4 percent from the same time last year to $890,0000 but down from a median price of $935,000 in August. Inventory increased significantly and price drops jumped. While the market is softening, the recent expanded presence of Google and Facebook on the Eastside means demand should stay strong.  In addition, the area’s excellent school system continues to be a large draw for buyers both locally and internationally.

King County

>>>Click image to view full report.

Inventory was up 68 percent year-over-year in King County due to a higher number of sellers listing their homes and fewer sales.  There is now more than two months of inventory in the county, a number we haven’t seen in nearly four years. Despite the increase, there is a long way to go to reach the four to six months of inventory that is considered balanced.  In September, the median price of a single-family home was $668,000; an increase of 7 percent from the same time last year and virtually unchanged from August.

Seattle

>>>Click image to view full report.

Inventory in Seattle surged in September from a year ago. Only San Jose, CA saw the number of homes for sale rise faster than Seattle last month. The median home price in September was $775,000. Up slightly from the $760,000 median price in August and a 7 percent increase from last year. The double-digit price growth of past years appear to be waning and overzealous sellers who listed their homes at unrealistically high prices have been forced to reduce them. Bidding wars have declined and the typical well-priced house is now selling right at asking price.

Snohomish County

>>>Click image to view full report.

While not nearly as dramatic as the case in King County, inventory in Snohomish County was up 40 percent. The area has just over two months of inventory with home prices moderating. The median price of a single-family home increased 8 percent over a year ago to $485,000. That’s down from the $492,000 median reached in August and $26,000 less than the peak of the market reached in spring.

View on https://windermereeastside.com/2018/10/08/local-market-update-october-2018/

Uncategorized October 3, 2018

How to Acquire the Right Appraisal for Your Home

Appraisals are designed to protect buyers, sellers, and lending institutions. They provide a reliable, independent valuation of a tract of land and the structure on it, whether it’s a house or a skyscraper. Below, you will find information about the appraisal process, what goes into them, their benefits and some tips on how to help make an appraisal go smoothly and efficiently.

Appraised value vs. market value

The appraised value of a property is what the bank thinks it’s worth, and that amount is determined by a professional, third-party appraiser. The appraiser’s valuation is based on a combination of comparative market sales and inspection of the property.

Market value, on the other hand, is what a buyer is willing to pay for a home or what homes of comparable value are selling for. A home’s appraised value and its market value are typically not the same. In fact, sometimes the appraised value is very different. An appraisal provides you with an invaluable reality check.

If you are in the process of setting the price of your home, you can gain some peace-of-mind by consulting an independent appraiser. Show him comparative values for your neighborhood, relevant documents, and give him a tour of your home, just as you would show it to a prospective buyer.

What information goes into an appraisal?

Professional appraisers consult a range of information sources, including multiple listing services, county tax assessor records, county courthouse records, and appraisal data records, in addition to talking to local real estate professionals.

They also conduct an inspection. Typically an appraiser’s inspection focuses on:

The condition of the property and home, inside and out
The home’s layout and features
Home updates
Overall quality of construction
Estimate of the home’s square footage (the gross living area “GLA”; garages and unfinished basements are estimated separately)
Permanent fixtures (for example, in-ground pools, as opposed to above-ground pools)
After considering all such information, the appraiser arrives at three different dollar amounts – one for the value of the land, one for the value of the structure, and one for their combined value. In many cases, the land will be worth more than the structure.

One thing to bear in mind is that an appraisal is not a substitute for a home inspection. An appraiser does a cursory assessment of a house and property. For a more detailed inspection, consult with a home inspector and/or a specialist in the area of concern.

Who pays and how long does it take?

The buyer usually pays for the appraisal unless they have negotiated otherwise. Depending on the lender, the appraisal may be paid in advance or incorporated into the application fee; some are due on delivery and some are billed at closing. Typical costs range from $275-$600, but this can vary from region to region.

An inspection usually takes anywhere from 15 minutes to several hours, depending on the size and complexity of your property. In addition, the appraiser spends time pulling up county records for the values of the houses around you. A full report comes to your loan officer, a real estate agent or lender within about a week.

If you are the seller, you won’t get a copy of an appraisal ordered by a buyer. Under the Equal Credit Opportunity Act, however, the buyer has the right to get a copy of the appraisal, but they must request it. Typically the requested appraisal is provided at closing.

What if the appraisal is too low?

If your appraisal comes in too low it can be a problem. Usually, the seller’s and the buyer’s real estate agents respond by looking for recent and pending sales of comparable homes. Sometimes this can influence the appraisal. If the final appraisal is well below what you have agreed to pay, you can renegotiate the contract or cancel it.

Where do you find a qualified appraiser?

Your bank or lending institution will find and hire an appraiser; Federal regulatory guidelines do not allow borrowers to order and provide an appraisal to a bank for lending purposes. If you want an appraisal for your own personal reasons and not to secure a mortgage or buy a homeowner’s insurance policy, you can do the hiring yourself. You can contact your lending institution and they can recommend qualified appraisers and you can choose one yourself or you can call your local Windermere Real Estate agent and they can make a recommendation for you. Once you have the name of some appraisers you can verify their status on the Federal Appraisal Subcommittee website.

Tips for hassle-free appraisals:

What can you do to make the appraisal process as smooth and efficient as possible? Make sure you provide your appraiser with the information he or she needs to get the job done. Get out your important documents and start checking off a list that includes the following:
A brief explanation of why you’re getting an appraisal
The date you’d like your appraisal to be completed
A copy of your deed, survey, purchase agreement, or other papers that pertain to the property
If you have a mortgage, your lender, the year you got your mortgage, the amount, the type of mortgage (FHA, VA, etc.), your interest rate, and any additional financing you have
A copy of your current real estate tax bill, statement of special assessments, balance owing and on what (for example, sewer, water)
Tell your appraiser if your property is listed for sale and if so, your asking price and listing agency
Any personal property that is included
If you’re selling an income-producing property, a breakdown of income and expenses for the last year or two and a copy of leases
A copy of the original house plans and specifications
A list of recent improvements and their costs
Any other information you feel may be relevant
By doing your homework, compiling the information your appraiser needs, and providing it at the beginning of the process, you can minimize unnecessary phone calls and delays and get the information you need quickly and satisfactorily!

This post originally appeared on the Windermere blog.

Uncategorized September 27, 2018

5 Dangers of Overpricing a Home

It is still a great time to be a seller, but the local real estate market has begun to soften. With significant increases in inventory, buyers now have more choices and less sense of urgency. If you are thinking about selling your home, pricing it correctly the first time is critical. Here’s why:

  1. If you overprice your home, it won’t show up in some search results.

    Buyers search for homes using the parameters they desire. Price range is one of the most critical. If you set an unrealistic price of $850,000 for your home, all the buyers searching for homes up to $825,000 will fail to see your property in their search results.

  2. An overpriced home attracts the wrong buyer.

    An overpriced home will not compare favorably with the realistically-valued homes in a buyer’s price bracket. If your home is missing the amenities, square footage or other features of homes within the price range you’ve placed it in it won’t sell.

  3. Overpriced homes linger on the market and risk becoming “stale”.

    The interest in a home is always highest when the listing first hits the market. When an overpriced home goes unsold for a long period of time buyers often wonder what is wrong with the property. When a buyer moves on from a listing they rarely come back, even if you drop the price.

  4. You run the risk of getting less for your home than if you priced it correctly the first time.

    A Zillow study showed that homes that linger on the market tend to sell for significantly less than their listing price. When a home sits on the market for an extended period of time, buyers feel they have lots of room to negotiate.

  5. The longer your home remains on the market, the more expenses you incur.

    Every month your home goes unsold you put out money for mortgage payments, utilities and other home expenses that you will never recover.

Setting a realistic price for your home from the start is critical. If you’re thinking of selling, our highly trained experts at Windermere Real Estate can provide you with a comprehensive pricing analysis based on current market conditions.

https://windermereeastside.com/2018/09/24/5-dangers-of-overpricing-a-home/